The layers of each digital world.
Semaphore holds each world in layers, from below the surface to orbit. The layers here are the Moon's. People see each layer in Semaphore's operations console once it is built, and software reads the same layers through software interfaces.
SampleThe same place in five of the layers below, each drawn from real data at the instants shown.


- places
- assets
- hazards
- light
- terrain
Layers
Each digital world draws on many independent sources. They include Semaphore's own measurements and derived products, and what missions and scientists publish. They also include public archives, such as NASA's Planetary Data System (PDS). Each sample below is real data from the sources it cites. A layer marked planned shows a public product it draws on.
| Layer | Holds |
|---|---|
| Terrain | digital elevation model of the whole surface |
| Imagery | orthoimages from orbit, to 50 cm |
| Light | horizons, illumination, and shadow |
| Places | nomenclature: official names and landing regions |
| Temperature | bolometric surface temperature |
| Resources | resource likelihood across the Moon |
| Gravity | gravity field and free-air anomaly |
| Radiation and space weather | particle rates and solar particle events |
| Assets | ephemerides, tracks, and plans |
| Hazards | keep-out boundaries and safety zones |
Terrain
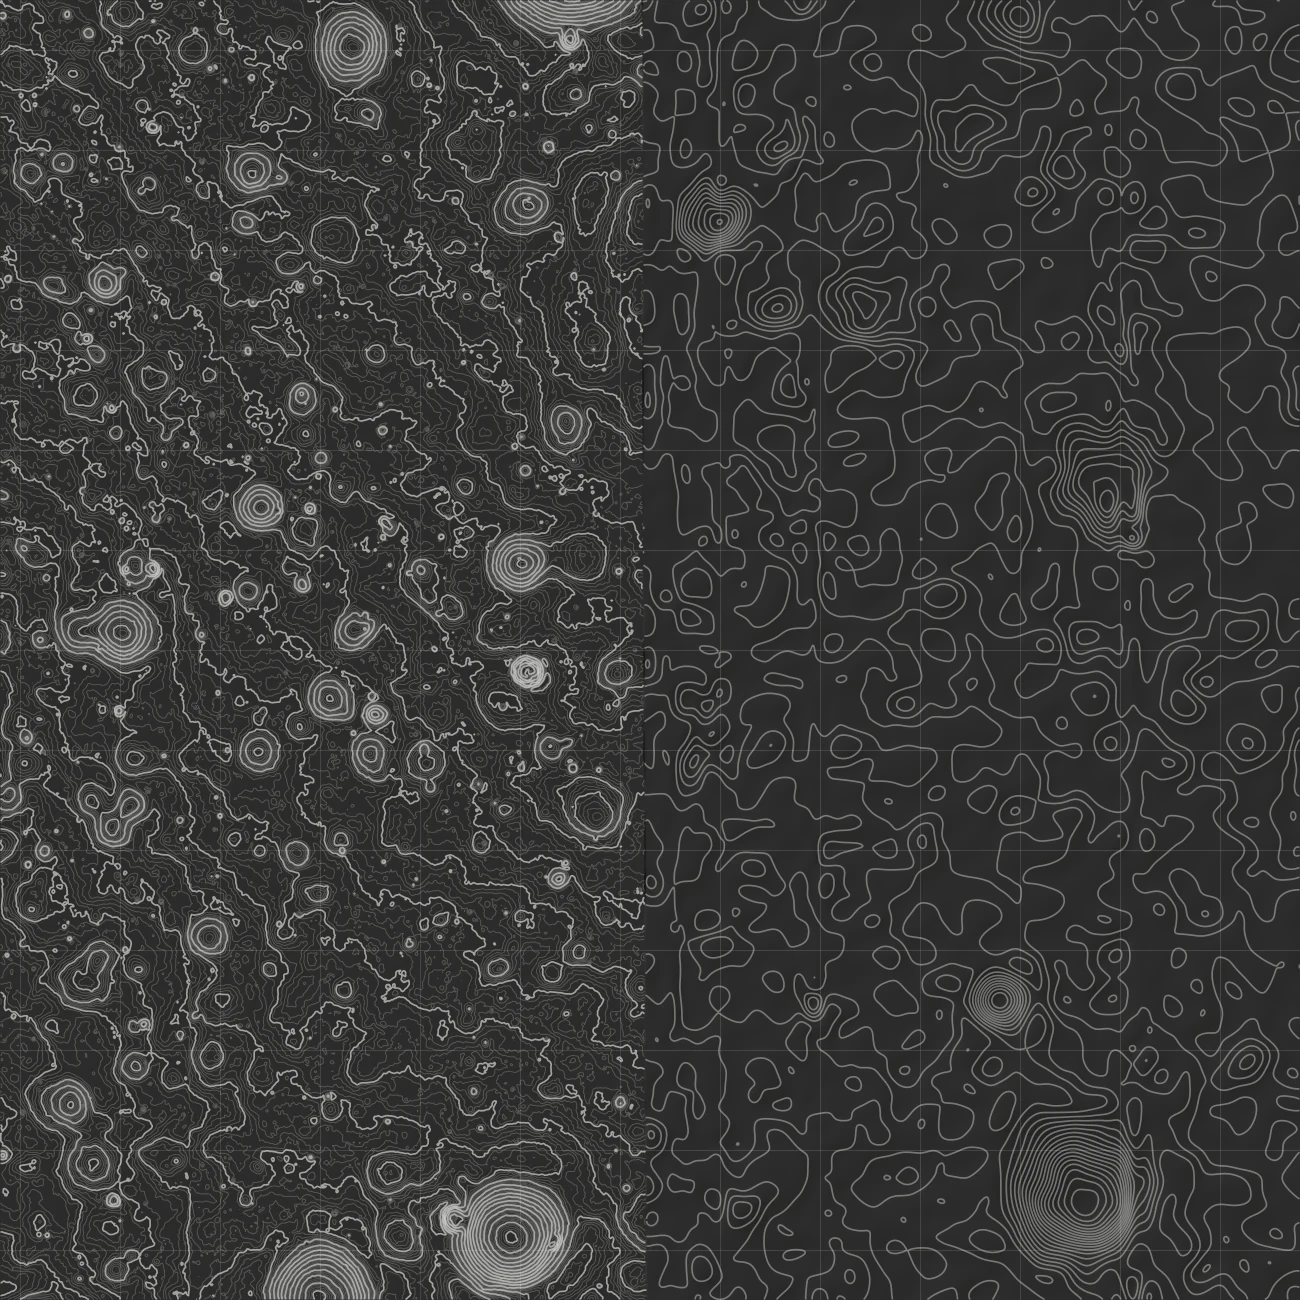
BuiltTerrain is a digital elevation model of the whole surface. Operators plan landings and traverses on it, and landers navigate by it.
- Method
- Each place takes its heights from the finest elevation model that covers it. A stereo model's heights are used only where its confidence map marks them reliable. Every tile keeps the Moon's curvature.
- Check
- Every tile's heights are compared with its sources at random points. Its mean error and its spread must stay within tolerance. Where a tile fails, the map shows its coarser parent tile instead.
- Sample
- The 2 m stereo model from the LRO Camera (LROC) at the Apollo 11 site, in 1 m contours on a 500 m grid. East of the dashed line, where that model ends, the 59 m SLDEM2015 model in 5 m contours.
- Formats
- 3D Tiles 1.1, a standard of the Open Geospatial Consortium (OGC)
(LROC; LROC on confidence maps; Henriksen et al. 2017; NASA Goddard; OGC 3D Tiles)
Imagery
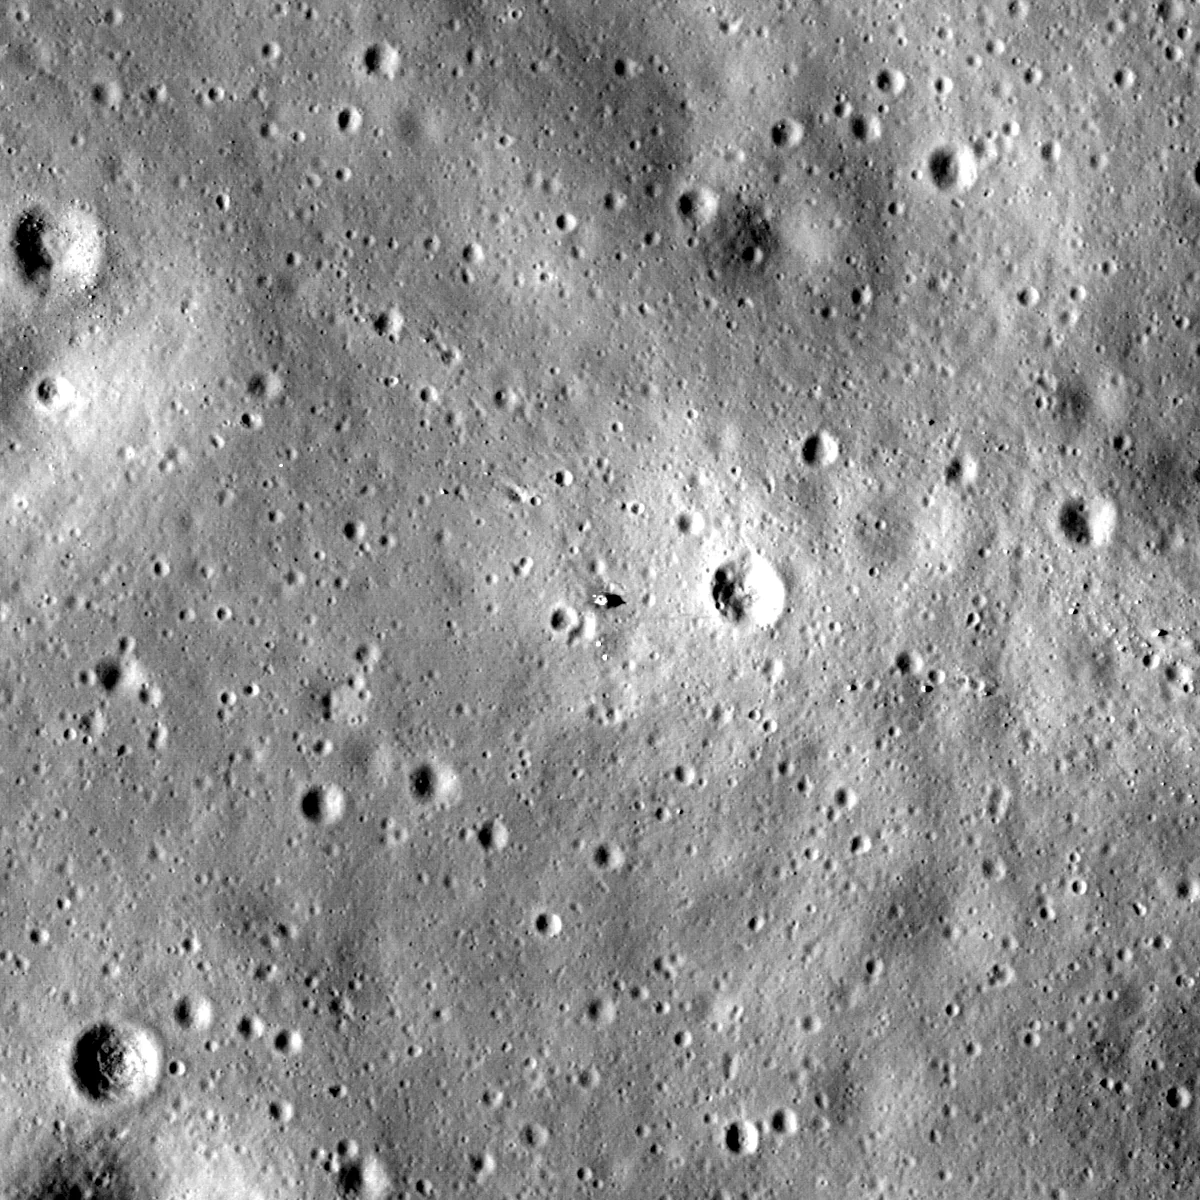
BuiltImagery is the surface as cameras in orbit see it, with each pixel placed on the ground. It shows surface detail such as boulders, fresh craters, and the hardware that past missions left behind.
- Method
- The whole Moon is the Wide Angle Camera mosaic from LRO, draped on the terrain as image tiles. Each site adds Narrow Angle Camera orthophotos at up to 50 cm. Each photo is placed by its archive label and matched in brightness to the whole-Moon map.
- Check
- Every tile must lie within one pixel of its source, measured on the ground. Each site photo must match the map's brightness within 5 percent.
- Sample
- The Apollo 11 descent stage at the center of a 600 m square, at the coordinates LROC publishes for it. The photo is the Narrow Angle Camera orthophoto of observation M150361817.
- Formats
- Image tiles in the OGC WorldCRS84Quad tile matrix set
Light
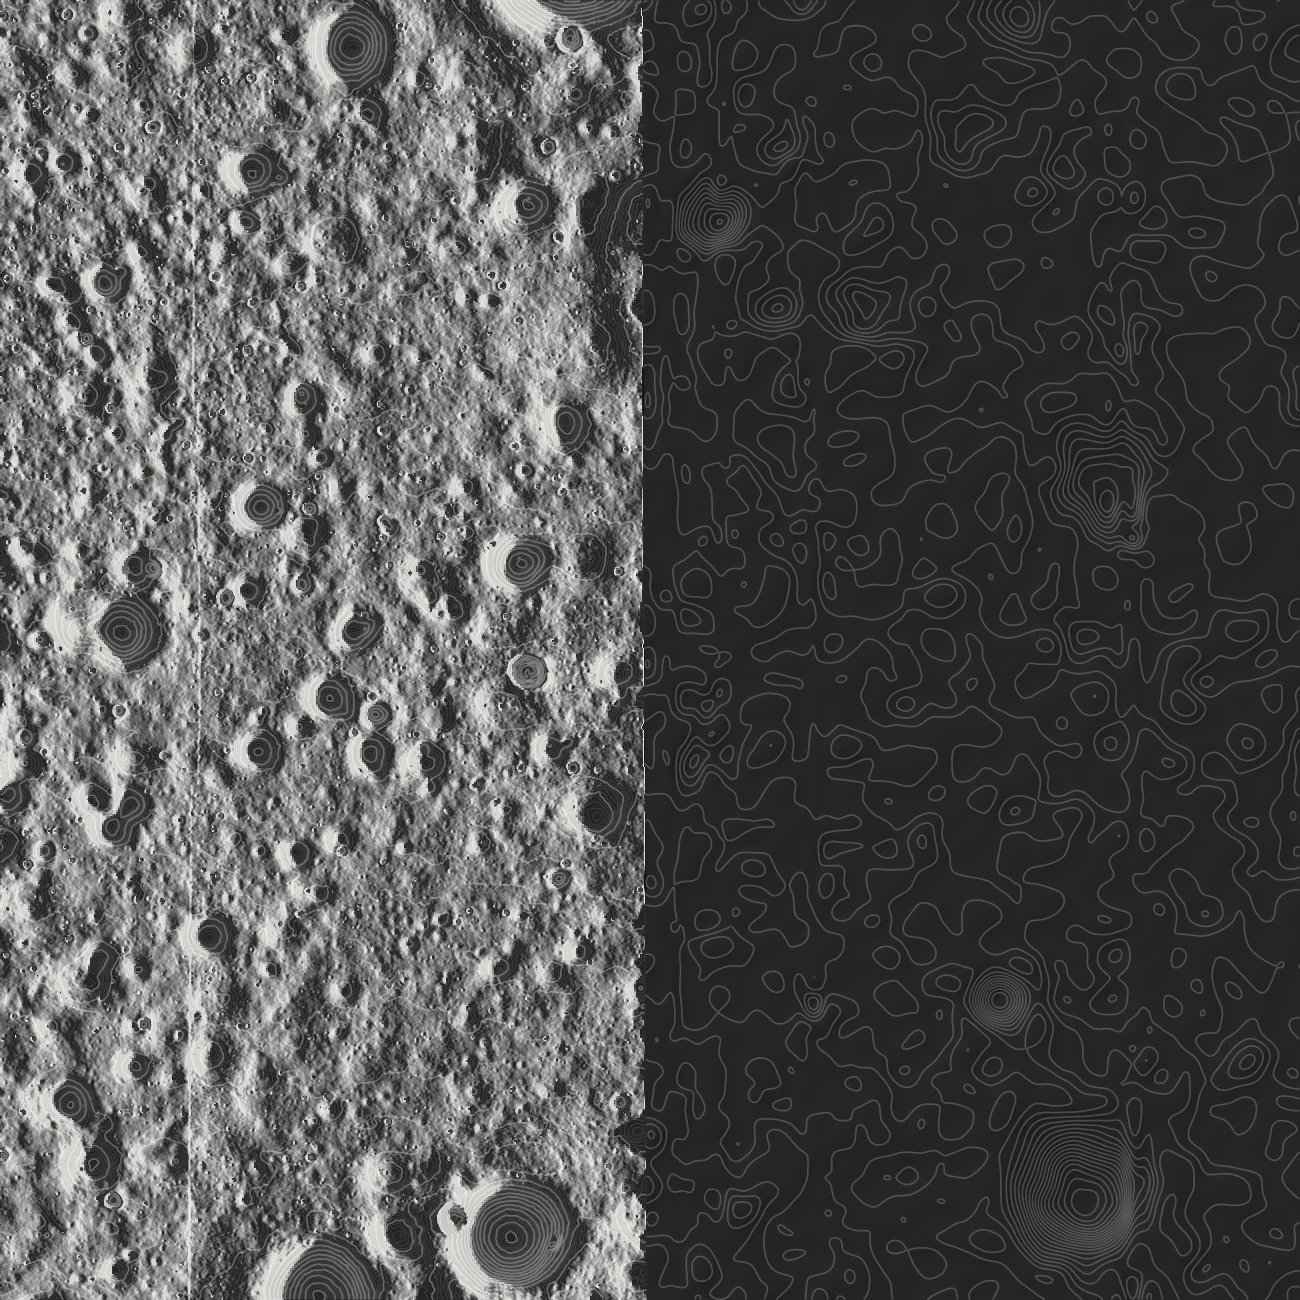
Built, south pole firstLight is where and when sunlight reaches the ground. It drives solar power and surface heat, and it sets what cameras can see. Near the poles it changes by the hour.
- Method
- For each point, Semaphore computes the horizon in every degree of azimuth on the curved Moon. Illumination at any instant then follows from the Sun's direction in NASA's planetary ephemeris.
- Check
- The horizons match an independent search to within two millionths of a degree. Every point in NASA's permanent shadow map stays dark, and average illumination agrees with NASA's published map.
- Sample
- One instant, computed for this sample from the 2 m model: 2026-05-22T08:00:00Z, with the Sun 2.6 degrees above the eastern horizon. East of the dashed line, where the 2 m model ends, the sample draws no light.
- Formats
- GeoTIFF, one band per degree of azimuth
(LROC; NASA Goddard on polar shadow; Mazarico et al. 2011; Park et al. 2021)
Places
BuiltPlaces are the official feature names, with the location and size of each feature. They give people and software one agreed name for each feature.
- Method
- Every name the International Astronomical Union (IAU) has approved, from the U.S. Geological Survey (USGS) Gazetteer, and NASA's nine candidate regions for a crewed landing. Each place records its center, its size, and the origin of its name.
- Check
- Each named crater is compared with the Robbins crater database, an independent catalog, and every mismatch is listed.
- Sample
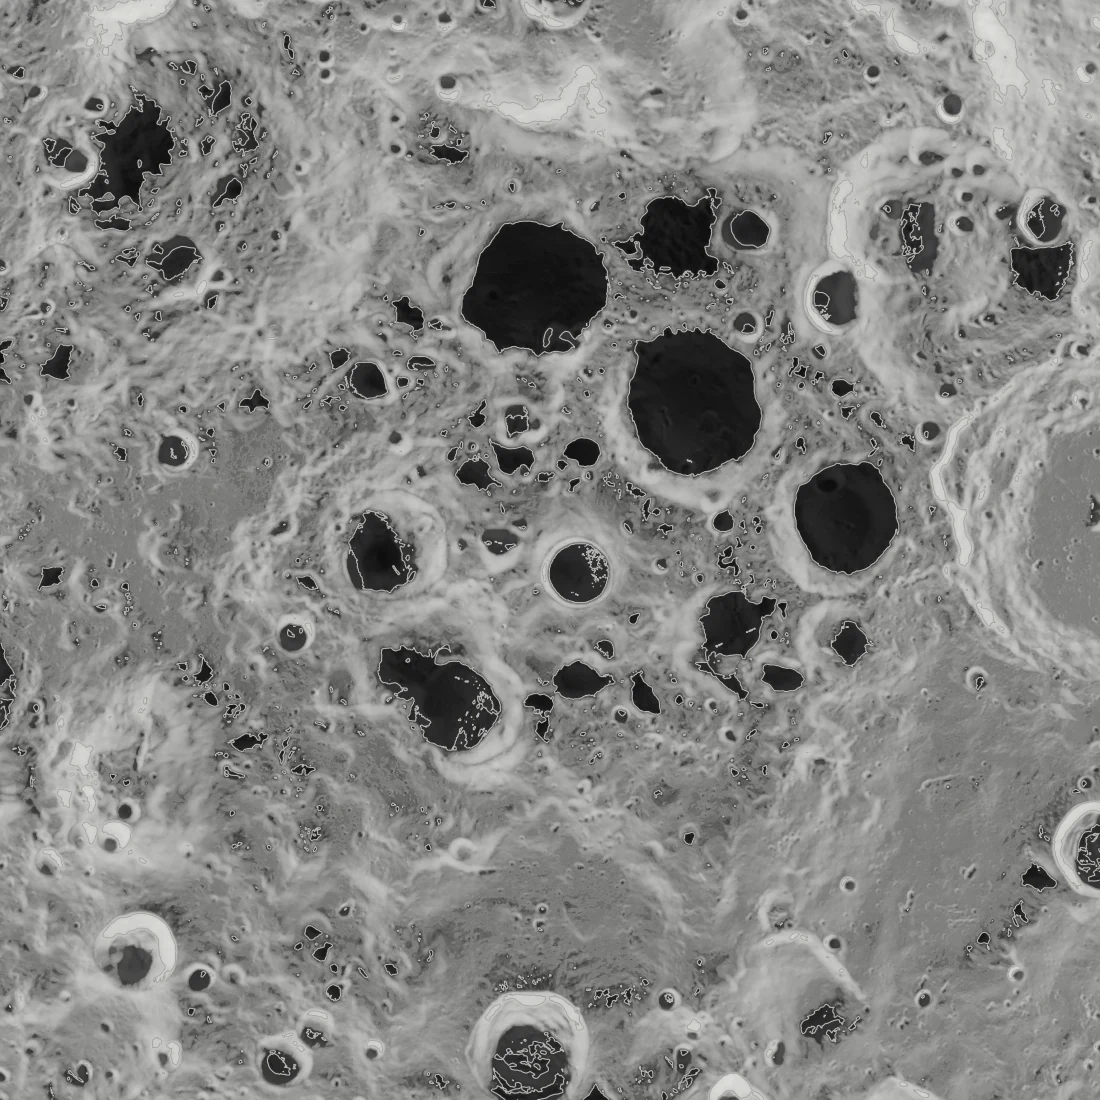
- IAU names at the south pole, at the Gazetteer's center points, over the Diviner temperature map.
- Formats
- Searchable records, and labels as vector tiles in a PMTiles archive
(USGS Gazetteer; USGS on landing regions; Robbins 2019; Williams et al. 2019)
Temperature
PlannedTemperature decides whether hardware and ice survive on the ground. Near the south pole, summer maximums range from 45 kelvin (K) on shadowed crater floors to over 300 K on sunlit slopes.
- Source
- Maps from the team of the Diviner radiometer on LRO. Each 240 m cell holds its highest bolometric temperature in summer, from nearly a decade of measurements.
- Sample
- Summer maximum temperature, black at 40 K to white at 340 K, with the 110 K line drawn.
Resources
PlannedResources are materials that missions can take from the ground instead of launching them from Earth. For example, water ice can supply drinking water and rocket propellant, and the regolith, the loose surface soil, can yield oxygen. This layer shows where each resource is likely to be found.
- Source
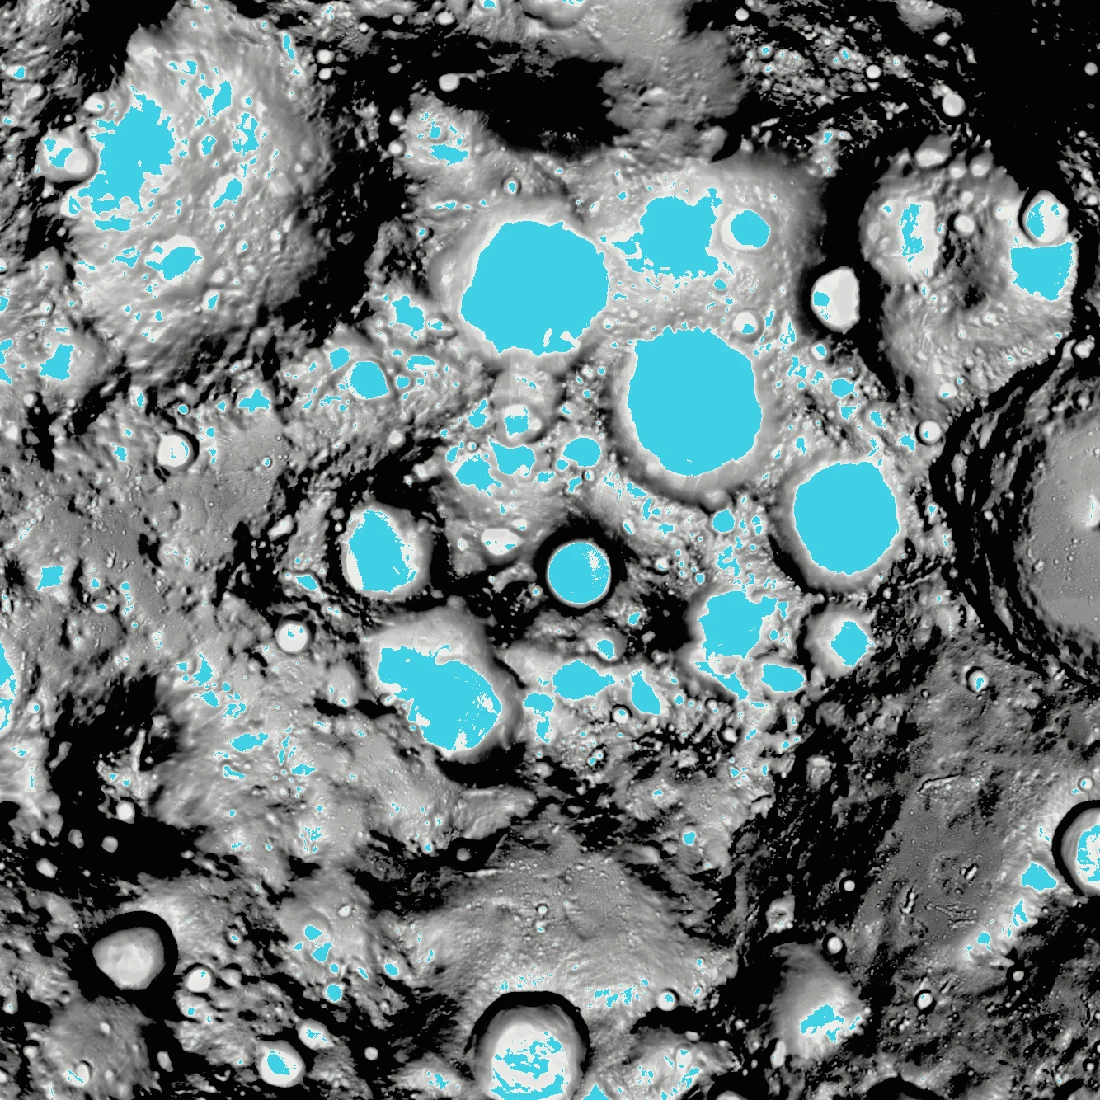
- The Diviner team's maps of cold traps and of the depth to stable ice. A cold trap stays below 110 K in summer, cold enough to hold water ice for a billion years. The area where ice is stable doubles at 2 cm below the surface.
- Sample
- Where water ice can survive at the south pole. Cyan marks the cold traps, 13,029 km² poleward of 80°S, which matches the 1.30 × 10⁴ km² the Diviner team reports. Grey shows the depth to stable ice, lighter where the ice is shallower and black where no ice is stable.
(NASA on resources; NASA Johnson; Williams et al. 2019; Schorghofer and Williams 2020)
Gravity
PlannedGravity is uneven. Dense masses called mascons lie under the maria, the dark lava plains. They pull most low orbits down. Missions spend fuel to hold their orbits, or fly in the few that stay stable without it.
- Source
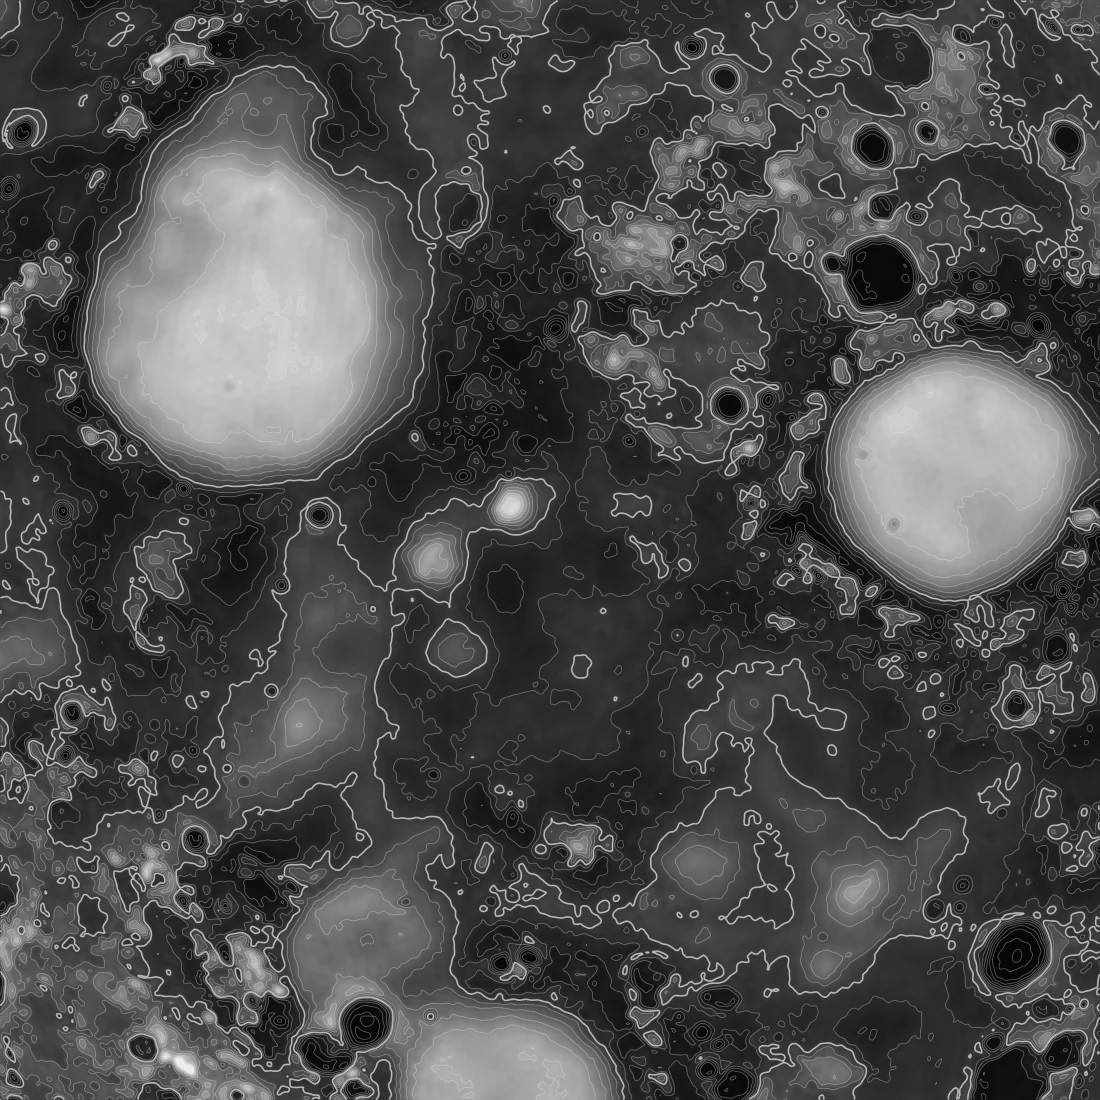
- GRGM900C, the gravity field NASA Goddard solved from the Gravity Recovery and Interior Laboratory (GRAIL) mission. The sample shows its free-air anomaly to degree 600, at a radius of 1,738 km.
- Sample
- Free-air gravity over the eastern nearside maria, bright for excess mass and dark for deficit, with contours every 50 milligals. The field correlates at 0.99 with an independent solution of the same GRAIL data from NASA's Jet Propulsion Laboratory (JPL).
(NASA PDS; Lemoine et al. 2014; Konopliv et al. 2014; NASA Ames on orbits)
Radiation and space weather
PlannedBeyond Earth's magnetic field, radiation has two main sources. Galactic cosmic rays arrive all the time, and the Sun adds bursts of energetic particles. Radiation limits how long crews can stay, and it can upset and degrade electronics.
- Source
- Good events counted each second by the Cosmic Ray Telescope for the Effects of Radiation (CRaTER) on LRO. Solar particle events from NASA's Space Weather Database Of Notifications, Knowledge, Information (DONKI).
- Sample
- CRaTER's daily rate in 2024, from one sample an hour. Quiet days run about 32 events per second, and the highest hourly sample reached 10,638 per second on 2024-06-08. All 15 days with the highest rates fall within a day of a solar particle event in DONKI.
Assets
PlannedAssets are the spacecraft, landers, and rovers that operators publish, with their positions, paths, and plans.
- Source
- Operators publish them as standard orbit messages, defined by the Consultative Committee for Space Data Systems (CCSDS). Public archives supply the paths of missions that share them.
- Sample
- LRO on a real pass, from its reconstructed ephemeris in NASA's archive. It passes 3.9 km east of the site at 65.9 km altitude, 1.60 km/s over the ground.
Hazards
PlannedHazards are the boundaries operators are asked to respect, and the rule behind each one. They help missions stay clear of each other and of protected heritage sites.
- Source
- Heritage boundaries from NASA's 2011 recommendations, and the safety zones that signatory nations declare under the Artemis Accords.
- Sample
- Both boundaries at Tranquility Base, with the site's IAU name. NASA recommends that rovers stay 75 m from the Apollo 11 descent stage. Landing spacecraft should stay outside 2.0 km and not fly over the site.